Games have scores. In traded markets, how is the score kept and why is it important.
In sports, games have scores that lead to a winner. Sometimes one team may dominate the game on the field (or pitch or what ever field of play), but they still don’t score more than the other team and they lose the game.
I like to look at the price action and technical tools applied to that price action, as a way to determine the score of the game and the winners in trading.
Now…. in the trading game, the game goes on and on and on. There really is not an end (although there may be a “halftime” break on weekends – but its not the “half” of anything).
Moreover, there can be games within games.

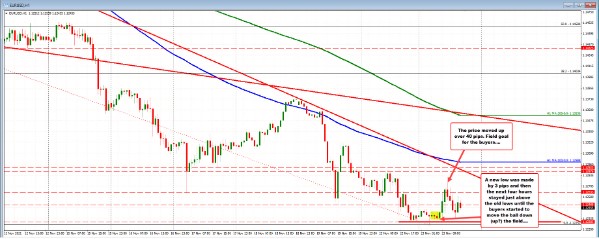
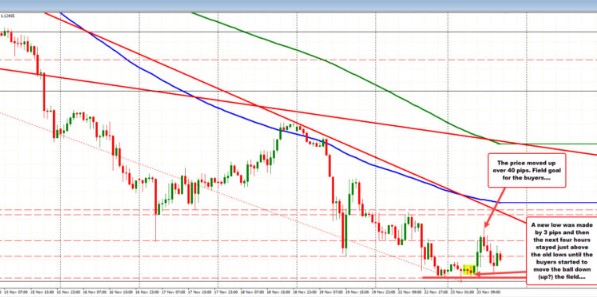
For example, looking at the EURUSD chart today (see chart above), a new low was made today for the year, but only by a few pips. The subsequent lows (the next 4 hourly bars on the hourly chart), found buyers ahead of the “new low”.
Are buyers winning? Well yes.
The price action is like watching a game. You can see a SMALL swing in momentum as long as the price action continues to do what it is doing (i.e. staying above the failed new low).
Now are the sellers losing during those 4 hourly bars? Well not really. The price is not really moving higher either. It is going sideways.
However, if there is a deciding vote it might be that the sellers had their shot. A new low was made by 3 pips or so, and the sellers could not push through toward the goal (i.e., the next target).
The price went higher. If you bought against a new low, the price moved up 40 pips. Your risk was a new low. The buyers scored a run (or a field goal). The game goes on.
What about the bigger game?
Looking more broadly at the hourly chart below, if you look at ‘the game’ from the October 28 high, the buyers are certainly not winning.

The price today reached another new low.
- The price is still near those lows despite the higher level on the day.
- The price is below a downward sloping trend line.
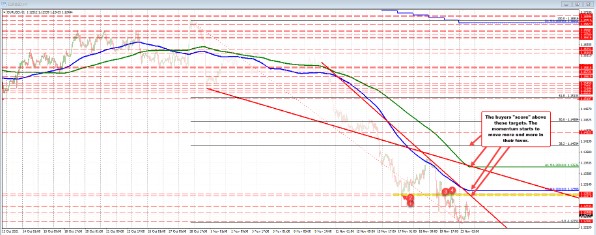
- It is below a swing area between 1.12876 to 1.12923 (see yellow area and red numbered circles).
- The price is below the 100 hour MA (blue line)
- The price is below the 200 hour MA (green line) and
- The 38.2% retracement of the move down from the October 28 high
If I were to rewind ‘the game’ back to October 28th and watch, there have been more runs (points) scored by the sellers – especially over the last 8-9 trading days after the break lower on November 10.
The sellers are definitely winning.
Remember, however, that the game in trading doesn’t really end. So as a trader we search out clues where the buyers start to win more. Where the sellers are losing more.
We need to find the spots in the trading game where the losing team starts to stage a comeback. Where the momentum of the game starts to turn. Where if it were an American football game, the losing team scores, then has a interception and scores again. Then stops the winning team on the next series and starts to drive.
For me, looking at the hourly chart that starts to happen when upside targets are reached and breached (and remain breached).
Breaking one is a step in the right direction. It is a score, but it is not “winning”.
For me, the next score would be to get above the swing area between 1.12876 to 1.12923 and the downward sloping trend line. That’s a touchdown.
Another score would be to get and stay above the 100 hour MA at 1.12988. Another touchdown.
The next major score would be to get above the 200 hour MA at 1.13536 (the broken trend line is also near that MA level). Touchdown.
Finally the 38.2% at 1.14034 would be another score. Touchdown.
Does all those have to happen for the buyers to win in trading?
No. The buyers who leaned in the 4 hour period against the low scored today as the price went higher. However, they are not winning the game. They scored a field goal, but overall the sellers have the game still in hand. They have big lead still.
Summary: If you as a traders can look at the price action and tools applied to that chart as if it were a sports game, you would be more in tune with the ebbs and flows from a control standpoint. You understand where the scores are made. Where the buyers overwhelm the sellers or the sellers overwhelm the buyers. You start to root for your team and understand the game more. You watch it like you watch your favorite team and ebb and flow with the momentum of the game.
If you can do that. If you can have a visual and feel the scores, you will be a better trader.
